Archive for October, 2007

Making Schools Work

pbs_logo.jpgFollowing on the theme of my last post on models of educational success… A couple of years ago, PBS produced a great program, “Making Schools Work” where they highlighted effective educational approaches such as Success for All, Comer School Development Program (SDP), and Knowledge is Power Program (KIPP). There is extensive research on Success for All and SDP demonstrating their effectiveness, particularly with low-income and ethnic minority populations. They also have been widely adopted by districts across the country. KIPP charter schools are newer and have less research, but the evidence that does exist is impressive.

Some common themes among them: A strong belief in the potential for every child to learn; high expectations; strong supports; a focus on developing a community and culture of learning; close monitoring of student progress; encouragement of input and/or involvement from community and parents.

Possibilities for low-income schools

Think the educational system for low-income ethnic minority children is hopeless? Then check out some of the research on 90-90-90 schools. This work shows that schools successfully educating such students do exist and the data points to some of the contributing factors. 90-90-90 schools are schools identified with the following characteristics:

• More than 90 percent of the students are eligible for free and reduced lunch, a commonly used surrogate for low-income families.
• More than 90 percent of the students are from ethnic minorities.
• More than 90 percent of the students met or achieved high academic standards, according to independently conducted tests of academic achievement.

There definitely is no silver bullet to accomplishing high achievement in such schools since they sometimes have very different needs and very different resources to meet those needs. There can never be a one size-fits-all solution. However, these schools show that it is possible and suggest some general qualities that contribute to success. Some common features of 90/90/90 schools:

• A focus on academic achievement
• Clear curriculum choices
• Frequent assessment of student progress and multiple opportunities for improvement
• An emphasis on nonfiction writing
• Collaborative scoring of student work

Learn more here.

Black-on-black violence = Self-hate?

Many of us have heard commentary about how black-on-black violence/murder is crippling the black community and how it represents a form of self-hatred. But how much evidence is there to support this belief? I went to the August 2007 special report, Black Victims of Violent Crime, produced by the Bureau of Justice Statistics (BJS) and found some data speaking to the issue. They report that between 2001 and 2005, 77% of blacks were victimized by other blacks. And in 2005 93% of black homicide victims were killed by other blacks. Pretty disturbing.

It may seem logical to make the leap to saying there is something really abnormal about blacks being so violent towards members of their own ethnic group; that is, until you look at the white crime patterns and find similar trends. 70% of white violent crime victims are committed by whites and 85% of white homicide victims were murdered by whites. It appears that intraracial violent crime is actually the norm.

Now, this is in NO way excusing or minimizing the violence problem in the black community. It would be ignorant to say we don’t have a problem just because intraracial crime is “normal.” It is a fact that homicide is the leading cause of death among black men ages 15-34; there is absolutely no way of getting around admitting this to be a tremendous problem. But does the fact alone that the majority of black homicide victims are killed by blacks mean that we posses a dysfunctional self-hatred? I’d say not, unless one believes that self-hate also motivates white violent crime. There may be plenty of other compelling arguments one can make to this point, but this is not one of them.

How are we doing in education?

pubimage.gifRecently, the National Center for Educational Statistics (NCES) published its report Status and Trends in the Education of Racial and Ethnic Minorities. There is some good news and bad news here. Some good news: Blacks and Latinos are increasing in terms of numbers going to college and numbers taking AP classes is increasing. Some bad news: the ethnic achievement gap is still pretty robust even though there has been some decrease over the decades; and Blacks have the highest retention and expulsion rates of all ethnic groups. Overall, I’d say the report suggests we have made some steps forward but still have quite a ways to go. Comments on the nature of the problem and courses of action?

Here are just a few points to ponder from the report:

Preprimary, elementary, and secondary education:

  • From 1993 to 2003, minorities increased as a proportion of public school enrollment, with schools in central city areas experiencing the most growth in the percentage of minority students. Hispanic students accounted for much of the increase in minorities in all types of locales.
  • In 2005, the majority of Black and Hispanic students attended schools with high minority enrollment (75 percent or more), while Asian/Pacific Islander and American Indian/Alaska Native students were more evenly distributed across schools with different levels of minority enrollment.

Achievement:

  • On the 2005 National Assessment of Educational Progress (NAEP) reading assessment, higher percentages of Asian/Pacific Islander and White 4th-graders and 8th-graders scored at or above Proficient than did American Indian/Alaska Native, Black, and Hispanic students at the same grade levels. On the 4th- and 8th-grade mathematics assessment, a higher proportion of Asians/Pacific Islanders scored at or above Proficient than did 4th- and 8th-graders of all other races/ethnicities shown.
  • From 1999 to 2005, the number of students taking Advanced Placement (AP) exams increased by a larger percentage among minority students than among White students. Asians had the highest mean AP exam score, while Blacks had the lowest.

Persistence:

  • In 2003, a higher percentage of Black elementary and secondary students than elementary and secondary students of any other race/ethnicity shown had been suspended from school at some point. Additionally, a higher percentage of elementary and secondary Black students had been retained a grade or expelled than was the case for White, Hispanic, or Asian/Pacific Islander elementary and secondary students.
  • In 2005, the percentage of 16- to 24-year-olds who were high school status dropouts was higher among Hispanics than among Blacks, Whites, and Asian/Pacific Islanders, and higher among Blacks and American Indian/Alaska Natives than among Whites and Asians/Pacific Islanders.

Student behaviors:

  • Birth rates for 15- to 19-year-old females of all races/ethnicities rose from 1985 to 1991 and declined from 1991 to 2004. While Black teenagers had the highest birth rates from 1990 to 1994, Hispanic teenagers have had the highest birth rate among teenagers of all races/ethnicities shown since 1995. Asian/Pacific Islander teenagers have had consistently lower birth rates than their peers.

Postsecondary participation:

  • Between 1976 and 2004, the percentage of total undergraduate enrollment who were minority students increased from 17 to 32 percent. By 1980, the percentage of females enrolled as undergraduates surpassed the percentage of males enrolled as undergraduates. In 2004, the gender gap was largest for Black undergraduates.
  • In 2004, more postsecondary degrees were awarded to Blacks than Hispanics, despite the fact that Hispanics made up a larger percentage of the total population.

The role and relevance of HBCUs

mie-spelman-logo-vert.jpgFor the first time, U.S. News and World Report provided a separate ranking of Historically Black Colleges and Universities (HBCU) with the top 5 being Spelman, Howard, Hampton, Morehouse, and Fisk (in that order). The ranking was not surprising to me (although I did expect Morehouse to be higher) but what was shocking to to me was a fact I heard while listening to Tavis Smiley. Tavis was interviewing Kenneth Terrell, an editor from U.S. and World report, when I heard Terrell express his surprise about the collective endowment of all HBCUs. It’s 2 billion dollars combined for over 100 schools. Even though I was well aware of the financial struggles of HBCUs, like Tavis, I was floored.

2 billion dollars?! That’s the same endowment of Williams College–one school with 1,000 fewer students than Morehouse. Harvard’s endowment is about 16 times that of all HBCUs combined. Amazing.

In the process of thinking about why these schools are so underfunded, I began thinking about broader issues with HBCUs. Are they still relevant today as they were when they were established? How well do these homogeneous settings prepare students for a heterogeneous world? For whom are they most appropriate?

Despite being a proud graduate of an HBCU myself, I can’t help but feel conflicted about some of these issues. On the one hand, HBCUs serve as important pipelines to all sorts of professions, and it is a fact that they are responsible for a large portion of the black professional workforce. They also serve as important centers for cultural affirmation in a world where blacks continue to be the most stigmatized. On the other hand, HBCUs offer fewer opportunities for students to grow beyond their cultural comfort zones, in my mind, a critical aspect of postsecondary education.

What say you?

A response to Janks Morton

Jank Morton’s response to my op-ed in the Baltimore Sun:

I reviewed your article, and I am at a point of concern as it relates to the symbiosis of the Justice Policy Institute and “Journalists” who continue to source this organization for this flawed comparison. I believe this point needs absolute clarification, and while you imply the truth lies between myself and the JPI, and you so diligently (and accurately) explain)the census data and its potential shortcomings, why did you not make one phone call to the NCES regarding the accuracy of the JPI data? If you would, please contact the NCES (202-502-7300) regarding the data for FY 2000 and you will find that NCES did not collect unduplicated 12 month headcount enrollment for African American males until FY 2001. The 603,032 number used by this organization, in its fraudulent inception was a mid-year forecast for fall enrollment ONLY (actual year end fall enrollment was 657,000) and their “study” did not include spring enrollment for 2000. And as we so readily refer constantly back to the JPI as “the source” for the cellblocks vs. classrooms data, and easily as my research and credibility is refuted by this source, why is that no one has “uncovered this story”. And your final assumption falls directly in line with fallacious postulate forwarded by this organization who massaged the data to justify an ends.

Finally your correct analysis of “the less representative the coverage of the survey, the less sure one can be of the accuracy of the estimated number. And – surprise – the Current Population Survey’s lowest coverage rate is among young black men” only helps support the argument that while the census coverage may be lacking as it relates to AA Males (a popular premise that I have not seen proved or disproved by any ones research) , the count still surpasses that which is incarcerated. So if they gather additional coverage is it not logical to assume the count would increase more? Please stop dumbing us down, do more fair and accurate research, before publishing and assuming the worst about us. – Janks Morton

My Response (sent to J. Morton):

My op-ed was a contribution to a discussion that Mr. Morton stated he hoped would be sparked by his film. Hopefully that discussion can continue without those with differing views slighting each other. I want to be absolutely clear that my intention of the op-ed was not to discredit Mr. Morton or his film. In fact, in the piece I mention that I am in agreement with him on two points: that there are more college-age black men in college than in jail and prison and that this age group comparison is the better one to make if one is to do so at all. But the bigger issue for me is not about the comparison between incarcerated black men vs. those in college. Rather, I am concerned about the overwhelming evidence that there are far too many black men incarcerated and the fact that they are so disproportionately represented behind bars. My analysis of the jail vs. college debate was to help us gain clarity on this issue in an effort to move on to the bigger questions.

There are currently over 830,000 black men in jail. Ultimately, whether that number is greater or less than the number in college doesn’t change this disturbing fact. Furthermore, I don’t consider stating this to be a problem which demands a solution to be assuming the worst of us or contributing to the negative image of black men. Nor does it assume that all black men are making no progress. Black men are making some progress; the increasing trend of black men attending college over the years is one example. It is also true that we are lagging in a number of areas—the incarceration rate is clearly one of them.

Since Mr. Morton expressed some concerns about the accuracy of what I presented I will lay out my rationale below and the facts behind them. However, as far as I am concerned you need not read further to get my point. Also, precisely for the reasons mentioned above, I do not find it productive to engage in a protracted debate about whether there are more black men in college than jail. But I do hope discussions about where we are, how we got here, where we should be headed, and how we should get there will continue.

Background on the two datasets

The National Center for Educational Statistics

In the article, I stated that the National Center of Educational Statistics (NCES) number is a more accurate number of black men in college. Here is some background of the dataset that may help further explain my reasoning. The methodology for the NCES number is pretty straightforward. It’s a headcount of all students in postsecondary schools from NCES’s Integrated Postsecondary Education Database (IPEDS). All schools that can disburse federal funds for financial aid (called Title IV schools) are mandated to complete a survey that includes questions about their student body. As a result, there is a very high response rate for this survey. For example, for fall 2005 enrollment, 99.9% of schools responded. There are some students from non-Title IV schools who are not included, but you can bet that number doesn’t change things much. No method of determining enrollment is perfect, but my position is that this approach is likely to be closest to capturing the real number.

The Current Population Survey (sometimes referred to as the “census”)

The reported Current Population Survey (CPS) number represents all Title IV and non-Title IV schools. However, the data collection method is very different from NCES. The CPS involves sampling the population and is more complicated in terms of how the number is derived. An important note is that this number is an estimate not a headcount like the NCES number. This means that it is based on the sample collected and then there is some number crunching involved to arrive at the 815,000 value for 2000 (and the 2005 estimate of 864,000). In basic terms, the estimate is determined by adjusting the sample number according to what is known about the entire population from which it was drawn.

When you have an estimated number like this that contains some sampling error, it is good practice to calculate a confidence interval if possible. The confidence interval takes into consideration sampling error and what it tells you is the probability of the actual number falling within a range of scores. I calculated this number for 2000 and found the 90th percentile confidence interval to be somewhere between 744,719 and 885,280. This means that, taking into consideration some error in calculating the estimated value, there is about a 90% chance that the real number falls somewhere within this range. As you can see, that’s a pretty wide range. If you are interested in seeing the details of how I calculated this you can email me.

Responses to Mr. Morton’s Comments

Below, I address the specific issues raised by Mr. Morton about my op-ed in a Q&A format:

Q: How do you know that the lowest coverage rate of the Current Population Survey is for black men? According to Mr. Morton there is no research demonstrating this.

A: I assure you that I did not make this up. The Census Bureau itself provides this information about the Current Population Survey. For example, in 2004, the lowest coverage rate among all combinations of age and sex groups was for black men aged 20-24 where the coverage was 61%. So for this group, undercoverage was 39%. The overall estimated undercoverage rate of the survey was 11%. But don’t take my word for it–see for yourself (table 1): http://www.census.gov/population/www/socdemo/school/2004SchoolS&A.pdf

Q: Doesn’t the fact that there was a low coverage rate for black men mean that the Current Population Survey number is an underestimate of the real number of black men in college? Or put another way, doesn’t it mean that if coverage were greater, the estimated number of black men in college would be higher?

A: Not necessarily. It all depends on who is in the sample. Think about it this way: if the sample contains a disproportionate number of college-going men in the sample in comparison to the real proportion of this group in the nation, there is the possibility of the estimated number actually being too high (an overestimate). On the other hand, it could be an underestimate if non-college-going men were disproportionately sampled. The point is, since we don’t know the “real” total number of black men in college we don’t know if we’ve oversampled or undersampled. That’s one of the reasons confidence intervals are useful—to give us a range of numbers that account for what is referred to as “error” in the sampling. But of course, if you can just count everyone you don’t have this problem.

Q: How about Mr. Morton’s comment regarding 12-month unduplicated data not being collected for black males from NCES until 2001 and the number you presented only representing fall enrollment?


A: I’m not entirely clear on what his argument is here, but it is true that the NCES number I mentioned is a count for the fall (and that they did not collect 12-month unduplicated data until 2001), but so is the CPS estimate Mr. Morton places more faith in (both surveys are conducted in around October). So they are comparable in that regard—they both represent the enrollment for about half the year (that is, if you think of the school year divided into 2 semesters). Likewise, the BJS jail and prison number that the NCES and CPS enrollment numbers are compared to represents one time-point at the middle of the calendar year (June)—not an entire calendar year. In terms of time frame, all of these numbers are roughly comparable. Furthermore, if one were to take the 2000 NCES number Mr. Morton claims to be more accurate (657,000) it’s still lower than the total number of black men in jail and prison in 2000 according to BJS (791,600).

Calculating the confidence interval for 2000 Current Population Survey (CPS)

I calculated the confidence interval based on the equation on the Census Bureau’s website found here. This is the equation:

for02.gif
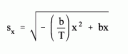
In the equation, “s” equals the standard error, “b” is a parameter provide by CPS, “T” is the total number of college-aged black men in the country between ages of 16 and 24 (11,529,241, I got this number from the 2000 decennial census), and “x” is the estimated value (815,000). Then the lower limit of the confidence interval is x – (1.645*s) and the upper limit is x + (1.645*s). So after doing the calculations based on these numbers, the 90th percentile confidence interval is between 744,719 and 885,280. Again, this means that, taking into consideration some error in calculating the estimated value, there is about a 90% probability that the real number falls somewhere between these two numbers.

Jail vs. college debate

My Op-ed in the Baltimore Sun…

baltimoresun.com

Are more black men really in jail than in college?

October 11, 2007

Are more black men behind bars than in college? The answer lies in who is doing the counting – and how.

A controversy is brewing about the veracity of this often-stated belief – one that is likely to be amplified by the injustice in Jena, La., and the new census report that more black people live in jails than in dormitories.

Unfortunately, the claims from neither side of the debate provide an accurate picture of the issue. We need to get a handle on the answer so we are not distracted from pursuing the larger question of why so many black men are incarcerated.

Part of the tension around this subject has to do with the film What Black Men Think, which in part aims to debunk the popular negative notions about black men. One point the filmmaker, Janks Morton, argues is that the notion that there are more black men in jail and prison than in college is false. In the film, most of the criticism is directed toward the Justice Policy Institute, which produced a 2002 report that Mr. Morton says sparked all the hoopla. Mr. Morton calls the report a con to benefit the Justice Policy Institute and the National Association for the Advancement of Colored People. Jason Ziedenberg, executive director of the institute, recently reiterated the validity of the report’s findings. But the real answer lies between their arguments.

The numbers in question from the Justice Policy Institute report come from the Bureau of Justice Statistics and the National Center for Education Statistics. The report indicates that there were an estimated 791,600 black men in jail and prison in 2000 and a count of 603,032 in college in 1999. Mr. Morton agrees with the jail and prison number but asserts in his blog that the more reliable U.S. Census Bureau reports that there were 816,000 black men in college in 2000. In the film, he makes comparisons using the same data sources for 2005 and states this number to be 864,000. Furthermore, he argues that it is bad practice to use the entire age range of black males when making these comparisons, because the age range for college-going males is generally 18 to 24, not the 18 to 55 (and up) range of the jail and prison population. Viewed this way, the ratio of black men in college compared with jail and prison is 4-to-1.

Mr. Morton’s position that the Census Bureau number is more accurate leads to the assumption that the number is a head count, similar to the decennial census. But the number really comes from the Current Population Survey, which is conducted by the Census Bureau but is not the census itself. This is a household survey administered to a sample of individuals in order to estimate the entire population. The less representative the coverage of the survey, the less sure one can be of the accuracy of the estimated number. And – surprise – the Current Population Survey’s lowest coverage rate is among young black men.

On the other hand, the number of college-going black males from the National Center for Education Statistics is from a mandatory institutional survey of all degree-granting institutions eligible to disburse federal financial aid funds (the overwhelming majority). No sampling is involved; they count all the students in the nation. This points to the greater reliability of the national center number over the Current Population Survey number.

Mr. Morton does make a very important point about the need for these kinds of comparisons to use relevant age groups, which the Justice Policy Institute report does not do.

The best evidence thus indicates that as a whole, there are more black men in jail and prison than in college – but there are more college-age black men in college than in jail and prison. It doesn’t make for a great sound bite; complex realities rarely do. But perhaps the primary focus of the discussion can now turn to why there are so many black men in jail – and what society can do about it.